

INTRODUCTION
Remote sensing is a series of techniques that study the Earth’s surface with the help of datasets recorded from various types of sensors. These sensors can either be satellite-based, airborne or mounted on drones, where the former are more suitable for acquiring regional information and the latter for more detailed data on smaller study areas. The sensors can measure in different parts of the electromagnetic spectrum:
- reflective remote sensing uses reflected sunlight in the visible to short-wave infrared region and an indication of the surface composition
- emissive (or thermal) remote sensing measures thermal infrared energy emitted by the ground, and can indicate surface compositions as well as surface temperatures.
- microwave remote sensing uses the reflected portion of the emitted microwave radiation and can give information on elevation, slopes and surface roughness.
- LiDAR remote sensing uses the reflected laser beam from an airplane to calculate very high resolution digital surface and terrain models (several measurement spots per square meter)
The main advantage of remote sensing is that it gives fast, reproducible information for large areas. It gives a synoptic overview that is often lost when the observer is located closer to the object like during field visits. Remote sensing as such does not replace fieldwork, but is most efficiently used in early stages of the exploration process, to get a regional overview (satellite data) followed by more detailed local analysis (airborne data) and efficient fieldwork to the most striking areas (see figure below for examples of platform types). As each remote sensing technique gives information on an important parameter (such as the surface composition). Several techniques are often combined to give the full picture and make the most use of their complementary nature. Remote sensing results are also complementary to several of the geophysical techniques (e.g. resistivity imaging and MT) as remote sensing focuses on the surface information and geophysics can give information about the deeper subsurface.

Figure 39 Different platforms that can carry remote sensing devices: spaceborne (satellite), airborne (plane) and drone (from left to right).
RELEVANCE FOR AND APPLICABILITY TO INDONESIA
Remote sensing can have a big impact on streamlining efforts in geothermal exploration. Detecting geothermal hotspots from thermal infrared data shows at which areas surface manifestations occur which can be targeted for mineralogic and geochemical sampling during a field campaign. Detecting clay alteration (see figure below) from short-wave infrared data allows to track current or historic areas of hydrothermal alteration that has caused the rocks to change in composition towards more clay rich areas. The type of clay that us detected is an indicator of the alteration conditions (e.g. pH) of the fluids involved and can be used to better understand the areas of hydrothermal upflow versus outflow. However, reflective and emissive remote sensing results are disturbed by vegetation cover which is often quite substantial in Indonesian areas prospective for geothermal resources. Even though steaming grounds and other surface manifestations typically influence and reduce the vegetation density, the surface areas that are free of vegetation and show elevated temperatures and clay altered ground are rather small to be effectively detected in satellite data (pixel size typically in the range of meters to tens of meters). Airborne data, however, does not have this restriction as low flying survey planes can produce datasets with pixel sizes in the range of centimetres to a few meters. They can detect anomalous surface temperatures and altered ground in small gaps of the vegetation canopy.
RADAR and LiDAR data can both create digital terrain models that can show the surface expression of fault lines, crater rims and other geologically interesting structures, such as the outline of different volcanic rock units and lava flows. Both of these techniques are much less restricted by vegetation cover than reflective and emissive remote sensing, and are very suitable datasets for the Indonesian context. High density LiDAR surveys fire hundreds of laser pulses per square meter. While many are reflected by the canopy, some will penetrate through small gaps and reach the understory and the ground surface. As part of the LiDAR data processing, the reflected laser pulses are classified into different reflection classes which allows to filter the data by either the first return (the top of the canopy) or by the last return (the ground underneath the canopy), which allows to study the shape of the actual terrain underlying the forest canopy.
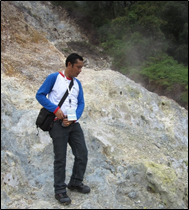
Figure 40 Example of extensive clay alteration in the geothermal area of Wayang Windu, West Java.
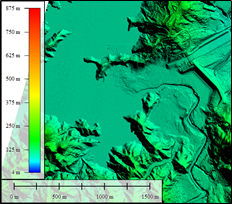
Figure 41 Example of LiDAR-derived DEM with artificial lighting to enhance tompographic expression. (Figure courtesy PT. Asi Pudjiastuti Geosurvey).
GEOCAP ACTIVITY IN THIS TOPIC
As part of GEOCAP workpackage 1.01, two train-the-trainer courses on Advanced Remote Sensing for Geothermal Exploration were given. The first edition given in November 2016 at ITB in Bandung focused on spectral and thermal satellite data processing with ASTER data, on LiDAR processing for geomorphological and structural interpretation, and on Synthetic Aperture RADAR processing for structural feature extraction. In a second course, given in July 2017 iat UGM in Yogyakarta, the material was extended with an interpretation and fieldvisit to the Dieng Plateau. This included satellite data interpretation for preparation of field checks, execution of the field checks and reporting of the results.
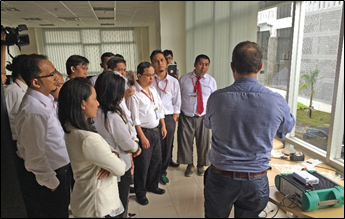
Figure 42 A portable infrared spectrometer for remote sensing field checking is demonstrated during the train-the-trainer course at ITB.
Additionally, GEOCAP also developed case applications of remote sensing for the Indonesian geothermal context in several other workpackages. WP 2.04 did a regional satellite remote sensing study on the geothermal Island of Flores (NTT). This study revealed potential areas of interest, one of which (Bajawa, Flores) was investigated in more detail during an campaign combining airborne LiDAR with thermal infrared mapping in June 2018. These data are part of MSc and PhD studies between UT-ITC and UGM.
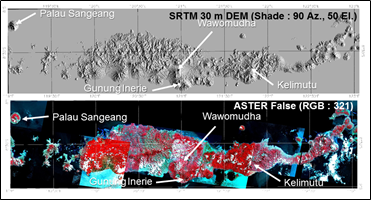
Figure 43 Example of data used in the regional remote sensing study of Flores Island. Above: Digital Terrain model with topographic shading derived from Shuttle RADAR Tomographic Mission data (NASA). Below: false colour composite of the visible and near infrared
As part of WP 2.08 on Governance and Rules & Regulations, GEOCAP partners ITB and UT-ITC did a remote sensing monitoring case study on the Patuha geothermal area of West Java. Land use and landcover changes were investigated with optical remote sensing, and subsidence due to the geothermal fluid extraction in the Patuha geothermal area, as well as ground water extraction in de Bandung region were investigated using interferometric synthetic aperture RADAR satellite data.
CONTACT
- Dr. Chris Hecker (UT-ITC)
- Dr. Agung Setianto (UGM)
- Dr. Asep Saepuloh (ITB)
- Dr. Robert Hewson (UT-ITC)