

The magnetotelluric (MT) method is a frequency domain electromagnetic tool that utilizes natural variation in the earth’s magnetic field as a source. The changes of Earth's magnetic field disturbed by solar wind and lightning activities induces electric currents beneath the earth's surface, called telluric currents (Figure 29).
Variations in the Earth’s natural magnetic field supply frequencies ranging from nearly DC (0.001 Hz) to ten Hertz. The wide frequency range MT gives us the ability to study the electric substructure of the Earth from near surface to greater depth. The large frequency range also means that the method can handle conductive overburden and has large penetration depth. The MT method measures simultaneously the electric and magnetic fields in two perpendicular directions. The ratio of the horizontal electric field to the orthogonal horizontal magnetic field (termed the EM impedance, Z), measured at a number of frequencies, gives Earth resistivity as a function of frequency or period, resulting in a form of depth sounding (Figure 29).
Figure 29 Basic principle of MT for imaging subsurface resistivity structure
Magnetotelluric (MT) imaging is the most powerful method to reconstruct a geothermal system model based on resistivity distribution. MT can be used to define top of reservoir, delineate geometry of reservoir and determine well target zones. The subsurface information derived from the MT data is then confirmed through drilling.
To provide better accuracy of resistivity distribution as well as further analysis using MT data, proper acquisition, processing, and modelling of the data should be applied (Figure 30).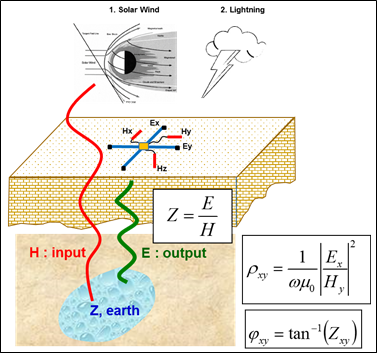
Figure 30 Flow chart of data acquisition through modelling/inversion (Daud et al., 2017)
Survey Design
MT survey design should be made by considering the geological condition of investigation area. We use remote sensing data to get initial important information related to boundary of lithology, indication of alteration as well as geological structure. Accordingly, the hypothesis of prospect area including its possible extension and boundary could be developed. Moreover, noise analysis is also needed as a consideration for locating MT equipment. The other important thing, finding suitable place for remote reference, because it plays important role in reducing electromagnetic noises, which contaminate MT data in local site.
Field Data Acquisition
A proper way of data acquisition with following standard operational procedure is important to carry out in order to get high quality data. Understanding the objective of the survey is also needed for planning efficient survey strategy.
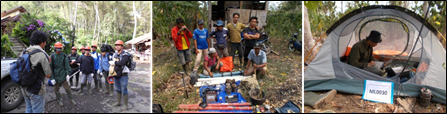
Figure 31 MT field data acquisition
Processing of MT Data
Data processing is the most important and influential stage in applying MT technology. As a passive geophysical method (depending on the natural source), MT is very sensitive to electromagnetic noises. Szarka (1988) and Chave & Jones (2012) have been discussed regarding influences of electromagnetic noises to MT data. Accordingly, for the first step in applying suitable processing is conducting time-series inspection and applying noise filter (Ismail et al., 2015). Figure 32 shows the result of before and after applying noise filter.
After applying several filters and data conversion, the MT result is represented by both apparent resistivity vs. frequency curve and phase vs. frequency curve. However, the curves have not directly a good result. Accordingly, data selection (sometimes called cross power selection) should be performed. Different method of data selection may produce different curve trend (Figure 33). Manual selection, which is done carefully with expert-judgement, is more recommended rather than auto-processing (automatically processed by software).
Before conducting data inversion, final data correction related to static shift effect should be overcome properly (Arnason, 2015). Otherwise, it will cause misinterpretation of subsurface resistivity data, increase drilling risk, and consequently increase financial risk. Static shift correction is mostly performed by conducting TDEM survey. However, several geothermal fields in Indonesia have no TDEM data. An alternative solution is applying geostatistical method using StaticShifter-X software (Daud, 2011). Based on several MT data, the results of static-shift corrections by using geostatistical data are comparable with those corrected by TDEM data. In addition, the inversion results of the both corrected MT data are comparable Figure 34).
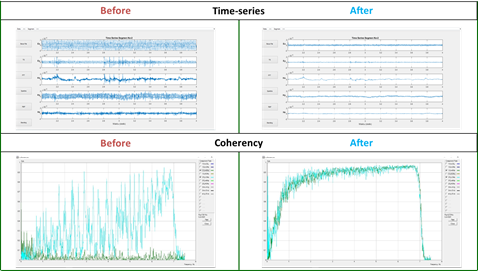
Figure 32 Condition of time-series and coherency before and after applying noise filters (Daud et al., 2017).
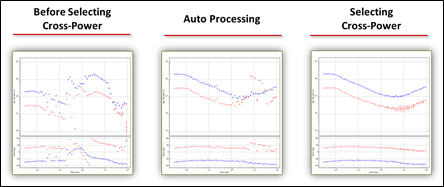
Figure 33 Comparison between before selecting cross power, auto-processing and "manual" selection (Daud et al., 2017).
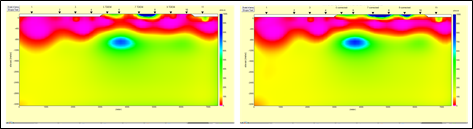
Figure 34 Comparison of inversion result of MT data after applying TDEM (left) and Geostatistic (right) (Daud et al., 2017).
MT Modelling Schemes
Choosing the most appropriate inversion scheme is also important. The real geological condition where geothermal area is located should be considered when selecting the proper modelling criteria for MT data. 1-D inversion method can be used in 1-D subsurface structure or stratified layer such as in sedimentary formation. 2-D inversion method can be used in 2-D subsurface structure or single geoelectric strike direction. Meanwhile, geothermal system in Indonesia is mostly related to volcanic activity, which is located in mountainous terrain with complex geological structure. Accordingly, the most reliable approach is 3D inversion.
Before conducting 3-D inversion, the most important to be considered is data input. EDI file as a SEG standard format for MT data should be produced by proper MT data processing. After checking the data input, the workflow of 3-D inversion can be followed (Error! Reference source not found.) (Daud et al., 2012), from initial model construction to the most appropriate model selection. Basic principle for selecting the most appropriate model is understanding the geothermal system. A hypothetical model about geothermal system should be in mind of modelling engineers. For giving better visualization of 3-D inversion result, 3-D visualization software such as GeoSlicer-X (Daud & Saputra, 2010) can be utilized. Several features can be optimized in form of resistivity section, resistivity map, 3-D cake model, iso-value, as well as observed vs. calculated data curves.
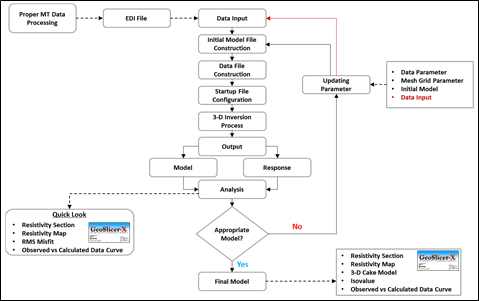
Figure 35 3-D inversion flowchart using MT3DInv-X software (Daud et al., 2017).
MT Data Interpretation
Interpretation is the crucial step of MT application in geothermal exploration. To achieve good interpretation result we need good data acquisition, good pre-processing as well as good inversion. Furthermore, good understanding of earth resources system (such as geothermal resources system) is necessary for achieving the best interpretation results.
Geothermal system, which has high salinity, clay alteration and high temperature, can be characterized by the resistivity value. The conductive zone (< 10 ohm-m) that commonly lies above geothermal systems has been shown to have a strong correlation with temperature between 70 and 200°C. The cause of this has been linked with the type of clay alteration that occurs in this temperature range (Ussher et al, 2000) (Figure 36).
The high temperature reservoir is the main objective of geothermal exploration. It could been seen beneath the conductive zone which has slightly higher resistivity value (>30 ohm-m) than the overlaying conductive zone. Alteration process involving conversion from smectite clays to illite or chlorite becomes the main factor of increasing the resistivity value (Figure 36).
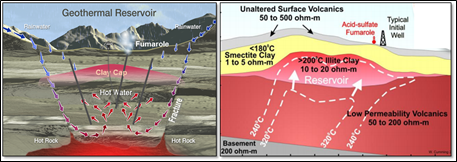
Figure 36 Simplified geothermal system with its resistivity characteristics
MT is a technology, where “the man behind the gun” (engineers) become the most important thing. Special treatment to the MT technology and innovations to the processing and modelling of the MT data should be applied carefully and appropriately. Otherwise, misleading information can be generated leading to unsuccessful recommendations (Error! Reference source not found. and Error! Reference source not found.). The MT results in Figure 9 (left) and Figure 10 (left) are in disagreements with drilling data. While the MT results in Figure 9 (right) and Figure 10 (right) after applying the innovation of MT technology (including filtering) are in good agreements with drilling data.
It should be a warning for geologist or interpreter wishing to use MT model for describing the geothermal system as well as determining the drilling target. Since MT data is not only a display of MT resistivity data, but also need proper way in the data processing. Accordingly, it is important to make a re-evaluation of the data processing of the existing MT data before continuing to further steps.
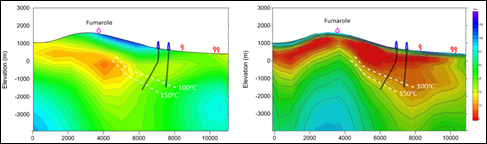
Figure 37 Correlation between MT and drilling result before (left) and after (right) applying the innovation to (Daud et al., 2017).
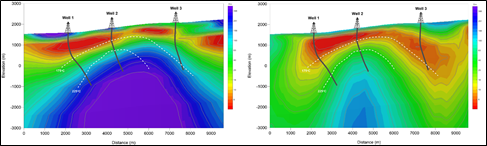
Figure 38 Correlation between MT and drilling result before (left) and after (right) applying the innovation (Daud et al., 2017).
References
- Arnason, K. (2015). The Static Shift Problem in MT Soundings. World Geothermal Congress. Melbourne, Australia.
- Chave, A. D., & Jones, A. G. (2012). The Magnetotelluric: Theory and Practice. Cambridge University Press.
- Daud, Y. (2011). StaticShifter-X: A Static Shift Correction Software for MT Data. Proceeding of API Annual Meeting 2011. Lampung, Indonesia.
- Daud, Y., & Saputra, R. (2010). GeoSlicer-X: A 3-D Interactive Software for Geothermal Data Analysis. World Geothermal Congress. Bali.
- Daud, Y., Darma, S., Nuqramadha, W., Pratama, S., & Fahmi, F. (2017). Applying Innovations in MT Technology for Reducing Geothermal Exploration Risks. Proceedings of 39th New Zealand Geothermal Workshop. Rotorua: New Zealand.
- Daud, Y., Heditama, D., Agung, L., Amriyah, Q., Nuqramadha, W. A., Pratama, S.
- A., & Saputra, R. (2012). 3-D Inversion of MT Data Using MT3DInv-X Software. The 12th Annual Indonesian Geothermal Association Meeting & Conference. Lampung. (2012)
- Ismail, M. L., Heditama, D. M., Dewi, R., Daud, Y., & Nuqramadha, W. A. (2015). Noise Elimination Technique in Magnetotelluric Data Using Digital Filter and Time Series Data Selection. Indonesia International Geothermal Convention & Exhibition 2015. Jakarta: INAGA.
- Szarka, L. (1988). Geophysical Aspects of Man-Made Electromagnetic Noise in the Earth - A Review.
- Ussher, G., Harvey, C., Johnstone, R., & Anderson, E. (2000). Understanding The Resistivities Observed in Geothermal System. World Geothermal Congress. Kyushu - Tohoku.
RELEVANCE FOR AND APPLICABILITY TO INDONESIA
MT technology has been widely used in Indonesia as the main exploration technology for delineating the subsurface low resistivity clay alteration (clay cap), interpreting the top and geometry of reservoir and indicating the subsurface temperature derived from resistivity distribution. By integrating the MT data with geological and geochemical data, a conceptual geothermal model and well targeting could be defined. Since most geothermal area in Indonesia have characteristics: located in high and rugged topography, the reservoir is usually deep and concealed, and in some parts of Indonesia influenced by high electromagnetic noises, therefore, careful and proper application of the MT technology should be done in many geothermal fields in Indonesia to obtain better results of the geothermal reservoir and finally better delineation of drilling targets.
GEOCAP ACTIVITY RELATED TO MT TECHNOLOGY
GEOCAP has a special training related to MT technology namely “MT Field School”. This training was delivered by GEOCAP member from UI (Dr. Yunus Daud) and IF Technology (Dr. Wouter van Leeuwen) for about 25 participants from universities and government agency. The training covered basic concept of MT technology, field data acquisition, processing, modelling and interpretation. Case studies were also delivered during the training.
In addition, deep MT survey, as a part of GEOCAP program, will be conducted in North Sumatera for delineating deep subsurface resistivity distribution related with possible geothermal occurrences associated to the tectonic and volcanic activity along the Great Sumatera Fault Zone. This program is part of the Joint Supervision PhD research program between University of Utrecht and Universitas Indonesia. The student involved is Lukman Sutrisno (from UI), supervised by Prof. Dr. J.D.M. van Wees (UU) and Prof. Widodo W. Purwanto (UI) and co-supervised by DR. Yunus Daud (UI) and Dr. D.D.P. Bonte (UU).
CONTACT
Yunus Daud (Universitas Indonesia)