

Introduction
As part of GEOCAP’s decision support topics, a quantitative software prototype tool was developed, allowing geologists, engineers and economists to integrate their disciplines and knowledge within a common framework, and to do that probabilistically. The purpose of the tool is decision support / decision analysis for project proposals related to a relatively immature geothermal asset, i.e. early in its life cycle and in an early phase of project maturation. It may be seen as a ‘screening’ tool, filtering out the less attractive project definitions, thereby understanding better, which project definitions have more potential. The tool is designed to explore the effects of all uncertainties that one typically has when computing forecasts. The tool has been distributed to the participants of the October/November 2017 course at PPSDM, Jakarta. It is freely available to anyone else, without protection of the source code. This allows users to adapt the code as they wish and tailor it to their specific needs. The tool uses relatively simple, analytical equations to model all the physics, the planning of projects within the asset’s life cycle, and the economics. Because of the analytical formulation, the tool does not allow reservoir heterogeneity to be modelled directly (i.e. by defining various geological layers and spatially heterogeneous, gridded reservoir property fields). Indirectly, however, representative correlations for the reservoir performance can be imported by the tool from a 3D numerical reservoir simulation study, if available. In addition, all wells are assumed to be identical, with differences only between injectors and producers.
The model is a full-field, full-physics Technical-to-Business XL-model consisting of coupled volumetric (Heat-In-Place), production (reservoir and well physics, thermodynamics of the steam turbine), and cashflow parts. It allows development plans to be assessed technically and economically. Output consists of a range of Key Performance Indicators (KPIs) and of various graphs of time-series etc. When combined with a Monte Carlo engine such as Crystal Ball or @Risk, the XL-model can compute stochastic time-series and histograms of KPIs. A particularly useful feature is the sensitivity analysis that can be done using Monte Carlo sampling. The model is targeted at geothermal assets (projects) that are relatively immature, i.e. assets with relatively large uncertainties for the non-controllable variables, and with a wide range of possible project definitions (controllable variables).  Typically, such geothermal fields, or geothermal development projects, would be in the ‘pre-feasibility’ or ‘concept selection’ phase. Results from studies done with this XL model may be used to narrow down (i.e. further frame) the possible project definitions to be elaborated in subsequent steps (FEED=Front-End Engineering and Design). In such further studies, more detailed models would be typically used. If considered useful, the Indonesian users may agree to maintain the tool jointly, whether or not in collaboration with the tool developers.
RELEVANCE FOR AND APPLICABILITY TO INDONESIA
When designing the GEOCAP programme, discussions were held with ITB in Bandung about the need to have a geothermal asset evaluation tool available to all interested Indonesian parties, allowing them to compute probabilistically an asset’s technical and economic performance over its life cycle. This resulted in the current version of the tool. To maximize accessibility to all, it was decided to programme it in XL, without any macros, and to leave the source code unprotected. This minimizes the feeling of a ‘black box’ and should facilitate the communication between the various disciplines, as they all can read directly what the XL code is doing. With a large number of output graphics, the user can also see directly what impact a change in assumptions has in terms of asset performance. A tool such as the GEOCAP asset evaluation tool could be regarded as a shared communication platform, even as a shared ‘language’, since all disciples are somehow represented in a common framework.
Also for government officials, it may be valuable to get acquainted with this communication platform as it may help them to better  understand the company’s perspective, including how the company perceives the pertinent risks. That again may help them understand whether a risk premium a company must negotiate with PLN, through the Power Purchasing Agreement tariffs, is reasonable.
GEOCAP ACTIVITY IN THIS TOPIC
The GEOCAP geothermal asset evaluation model was constructed by TNO in the Netherlands, in collaboration with ITB (Bandung) and IF Technology (Netherlands). The tool’s development phases consisted of 1) functional specification, 2) software design, 3) tool construction, 4) testing, 5) debugging, 6) verification, 7) documentation, 8) dissemination / release. Below, a description of some headlines of the tool is given.
The model consists of a volumetric part, which computes the Heat-In-Place and the theoretically maximum possible electrical power capacity from this Heat-In-Place, based on a given economic lifetime and some empirical correlations. The (volcanic) reservoir is assumed to be non-depletable over the asset's life cycle, both in terms of fluid/mass-in-place and in terms of heat-in-place. Produced fluid is assumed to be replenished by injected fluid and/or natural water influx (meteoric water, other groundwater), heat is assumed to be unlimited in production terms, as over 90% of the Heat-In-Place is assumed to be in the solid minerals of the rock, which would re-supply the heat to the re-injected cooled-down fluids in the pores at an, in practical terms, unlimited rate. In addition, it is assumed that in practical terms Heat-In-Place and mass/heat production is hardly influenced by whether the reservoir fluids consist of steam plus water, or just water. Existing studies argue that this difference can be assumed to be negligible. Based on the steady-state well inflow equation, the model then computes the mass and heat production per well. The steady-state inflow equation corrects the drainage area per well for the number of (initial and incremental) wells. The given (initial) skin-factor per well influences the well's productivity. A user-defined skin build-up rate (factor/year) results in the well's productivity to decline over the years, until a skin-removal workover is scheduled and the skin factor is re-set at the original value. The user can supply the workover frequency. The workover opex will be accrued to the cash-out cashflow.
 Wells with individual, heterogeneous properties and separate field-sectors (e.g. fault-blocks) cannot be modelled. All wells are assumed to be identical, and the reservoir is just one body with a constant reservoir-boundary pressure that does not deplete in time. For input variables that are heterogeneous in space and/or changing in time, it is assumed that they can be adequately represented by field-wide average values. This assumption is a coarse simplification and should in principle be verified by calibration to more detailed models. However, as a first approximation it may well be a valid assumption. All yearly average production is corrected for a given load time (uptime) factor, or for the given number of running hours per year. Total field production is the sum of all individual well production rates, unless constrained by surface facilities. A targeted plateau production can be given: the model will automatically drill additional wells if the target is not being met (e.g. due to well deterioration, or if the target rate is increased in a given year). The number of production wells to be drilled each year is then used to calculate the yearly drilling expenditure (drillex) and, hence, depreciation, tax and net cash flow. The user can supply a producer to injector ratio. When specifying / computing a new production well, the corresponding number of injectors will be automatically drilled and accrued to the drillex, and later to the well-opex (e.g. for the number of workovers to be done). Drillex tax depreciation also follows automatically.
Below are some examples of input and output of the GEOCAP tool.
![]()
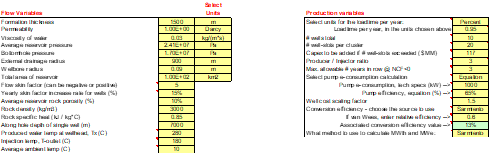
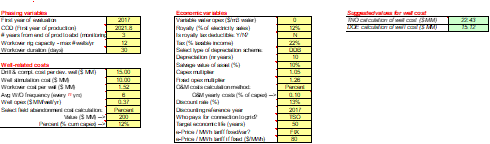
Time-series input variables: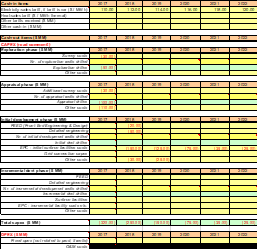
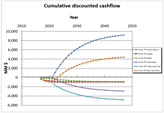
Cashflow output: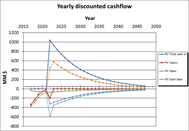
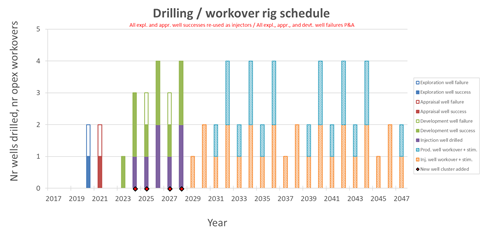
The drilling schedule is a combination of input and calculated results of well success, based on some user-defined drilling success learning curve, and on a given producer/injector ratio. The successful wells define the field’s production rate.
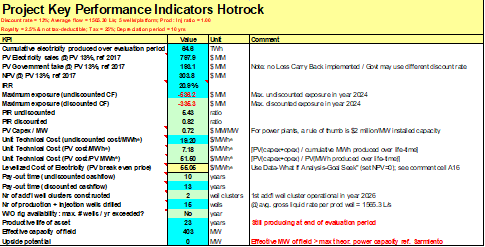
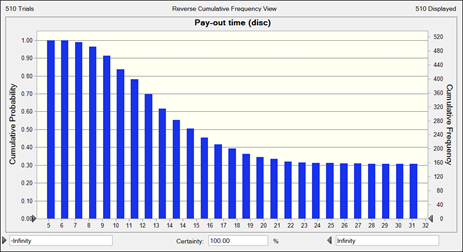
Eventually, the field’s life-cycle performance is captured in series of so-called Key Performance Indicators (KPIs). When combined with a statistical XL plug-in (such as Crystal Ball or @Risk), all KPIs can be computed probabilistically and be displayed as (cumulative) histograms (or probability density functions). This allows the project team to understand risk and upside potential, to design risk mitigation strategies, and/or to design flexibility options to ‘chase the upside’. The list of KPIs is given below:
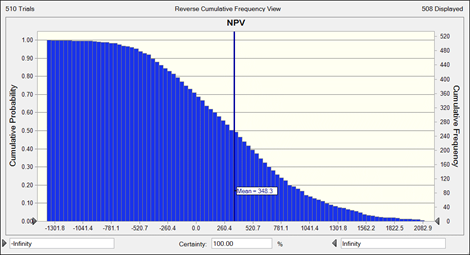
In addition, some possible histograms are displayed:
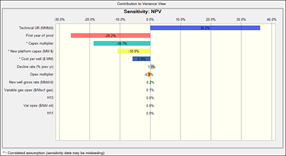
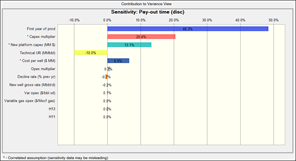
Also, some sensitivity analysis features follow below:
CONTACT
- Ali Ashat (ITB)
- Christian Bos (TNO)